
If you are new to stock trading or investing, you might have heard the words support and resistance. These are very important ideas that help traders decide when to buy or sell stocks. In this blog post, we will explain support and resistance in simple language and show examples from the Indian stock market. By the end, you will understand how these levels can help you make better trading decisions.
What is Support?
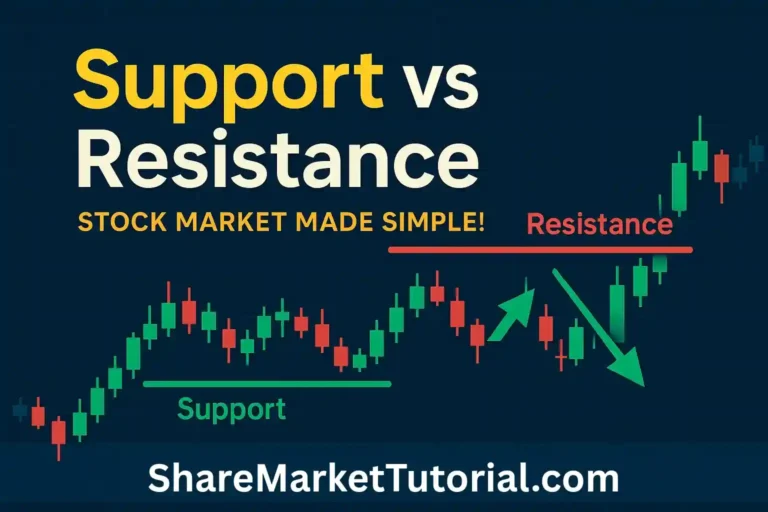
Support is a price level where a stock usually stops falling and starts to rise again. Think of support as a floor that stops the price from going lower. When a stock price reaches this floor, many buyers feel it is a good price to buy, so the demand increases and the price goes up.
For example, take Reliance Industries, one of India’s biggest companies. Suppose its stock price falls to ₹2,000 but does not go below this level for some time. This ₹2,000 price acts as support because buyers come in and stop the price from falling further. Traders watch this support level carefully because if the price falls below ₹2,000, it might continue to fall further.
What is Resistance?
Resistance is the opposite of support. It is a price level where a stock usually stops rising and starts to fall. You can think of resistance as a ceiling that stops the price from going higher. When a stock reaches resistance, many sellers feel the stock price is high, so they start selling, and the price falls.
For example, consider Infosys, a major IT company in India. If its stock price rises to ₹1,500 but struggles to go above this level, ₹1,500 is called the resistance. Sellers come in at this price, and the stock price may fall after reaching this resistance.
Why are Support and Resistance Important in the Stock Market?
Support and resistance levels are important because they help traders and investors make good decisions. Here’s how:
- Buying near support: When a stock price is near support, many traders buy because they expect the price to rise from this level.
- Selling near resistance: When a stock price is near resistance, many traders sell because they expect the price to fall.
- Risk management: Knowing these levels helps traders set stop-loss orders (limits on losses) and plan profits.
- Predicting price movements: Support and resistance help predict how the stock price might move in the future.
Using these levels reduces guesswork and makes trading safer and more predictable.
How to Identify Stock Market Support and Resistance?
Identifying support and resistance is not very difficult. You can start with simple methods:
- Look at past price charts: Find levels where the stock price has stopped falling or rising many times before.
- Draw trendlines: Connect the lows to find support and the highs to find resistance.
- Use moving averages: Tools like 50-day or 200-day moving averages often act as support or resistance.
- Use Indian stock websites: Websites like NSE India, Moneycontrol, and Investing.com offer free charts for Indian stocks where you can spot these levels.
Real-Life Example from the Indian Market
Let’s look at a recent example with HDFC Bank:
In the past year, HDFC Bank’s stock price found strong support around ₹1,400. Every time the price dropped near ₹1,400, buyers came in, and the price bounced back up. On the other hand, the stock faced resistance near ₹1,600. Each time it reached ₹1,600, sellers sold their shares, and the price fell.
Traders who bought near ₹1,400 support and sold near ₹1,600 resistance made good profits. This simple strategy of buying at support and selling at resistance works well when you watch the charts carefully.
Conclusion
Support and resistance are basic but powerful concepts in stock trading. They help you understand when to buy, when to sell, and how to manage risks. By learning to spot these levels, especially on Indian stocks like Reliance, Infosys, or HDFC Bank, you can improve your chances of success in the stock market.
If you are new, start with small investments and practice identifying support and resistance on Indian market charts. With time, you will get better and make smarter trading decisions.