
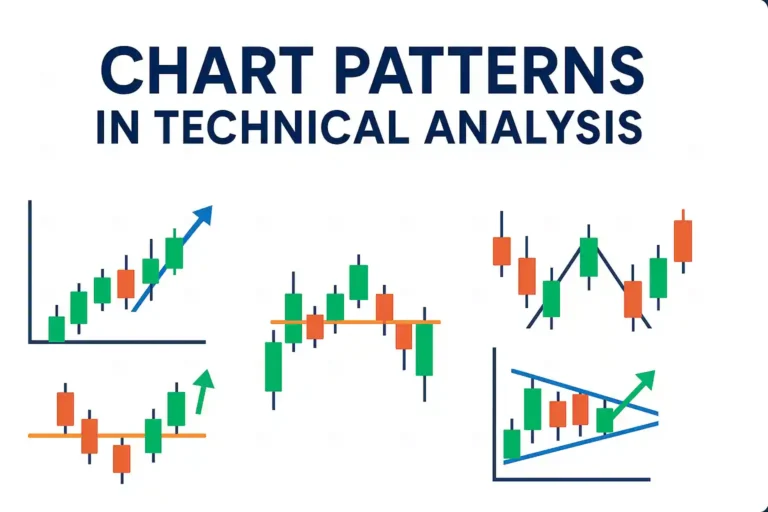
When you start trading or investing in the stock market, understanding how prices move is very important. One of the best ways to study price movement is through technical analysis. In this blog post, we will learn about chart patterns, which are powerful tools used in technical analysis. We will also see how these patterns work using examples from the Indian stock market.
What Are Chart Patterns?
A chart pattern is a shape or formation on a stock’s price chart. These shapes are created by the movement of stock prices over time. Traders use these patterns to guess what might happen next—whether the price will go up, down, or stay the same.
These patterns reflect the behavior of buyers and sellers, and they help traders decide when to buy, sell, or wait.
Types of Chart Patterns
Chart patterns are mainly divided into two types:
- Reversal Patterns – These patterns show that the current trend is about to change.
- Continuation Patterns – These patterns show that the trend will likely continue after a short break.
Let’s look at each type with examples from the Indian stock market.
Reversal Chart Patterns
1. Head and Shoulders
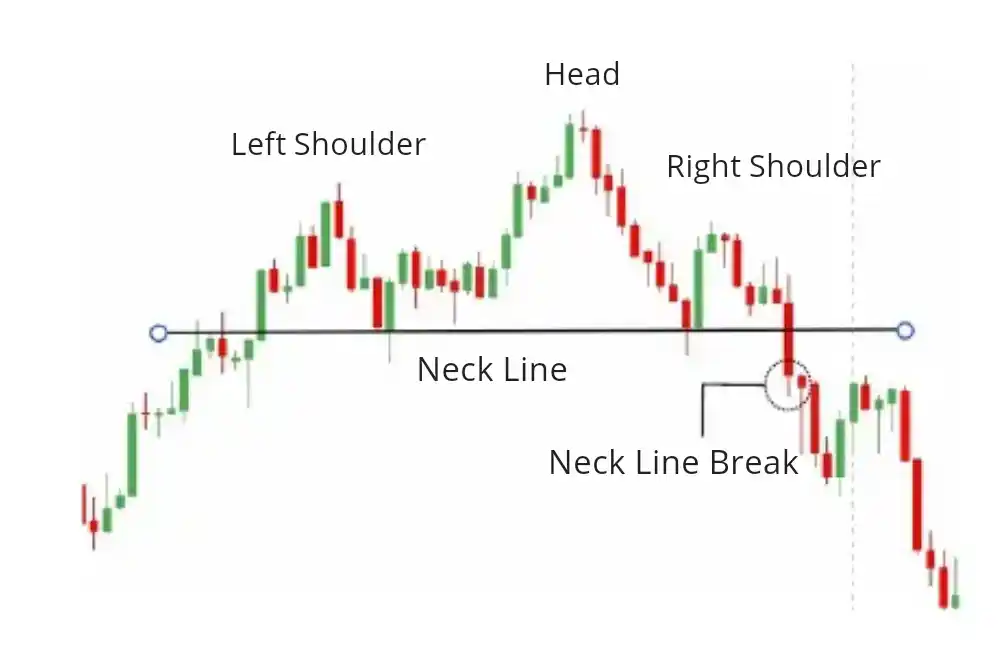
This pattern looks like a head with two shoulders. It shows that an upward trend is about to turn down.
Example:
HDFC Bank showed a head and shoulders pattern in 2022. After forming this pattern near ₹1,700, the price started to fall.
2. Inverse Head and Shoulders
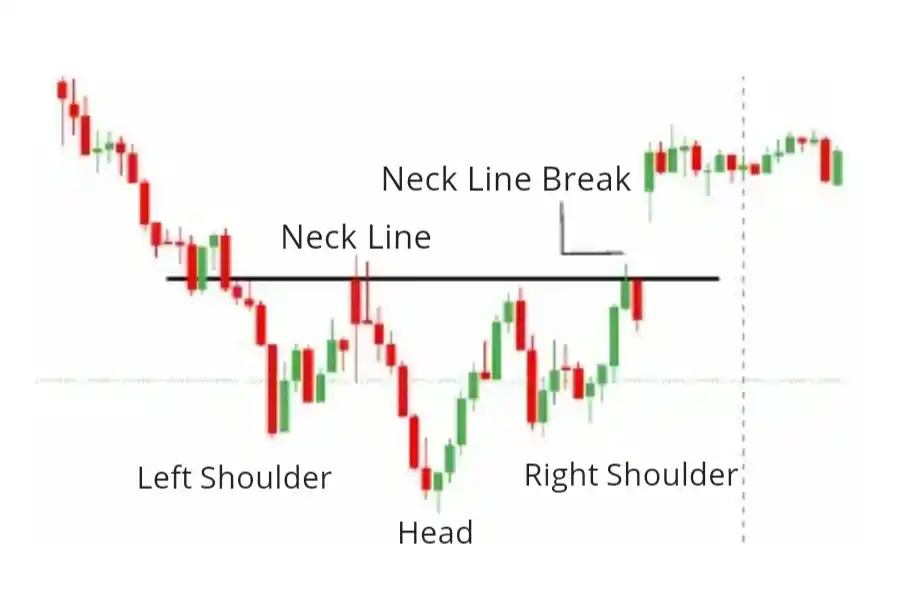
This is the opposite of the head and shoulders. It shows that a downtrend may turn into an uptrend.
Example:
Infosys formed this pattern in early 2023 around ₹1,200. After that, the stock moved up.
3. Double Top
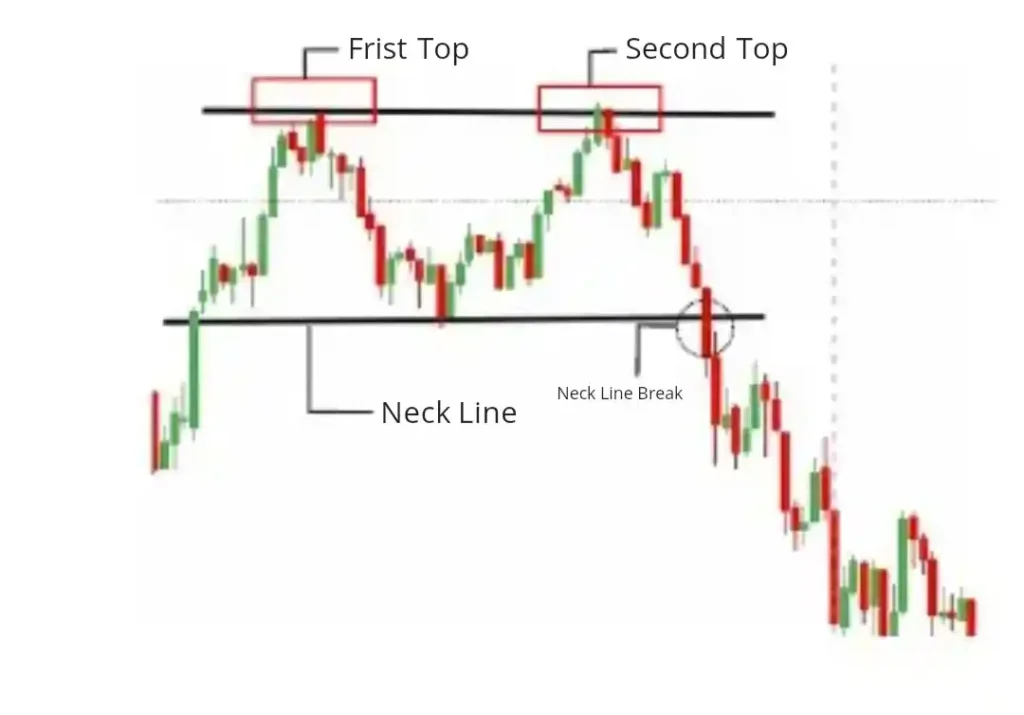
This pattern shows the price hits a high level two times but fails to go higher. It usually signals a price fall.
Example:
Maruti Suzuki formed a double top around ₹9,500 before the price started to drop.
4. Double Bottom
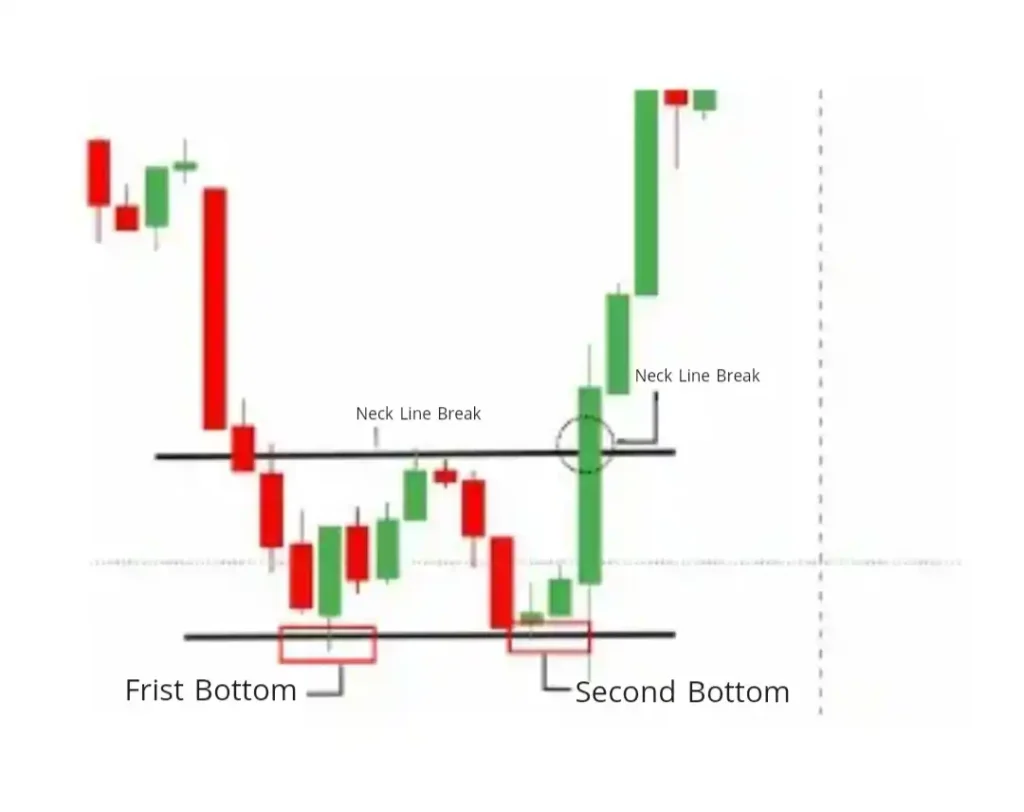
Here, the price drops twice to the same level but doesn’t go lower. It signals a possible price rise.
Example:
Tata Motors formed a double bottom around ₹500, and then the stock moved upward.
5. Triple Top and Triple Bottom
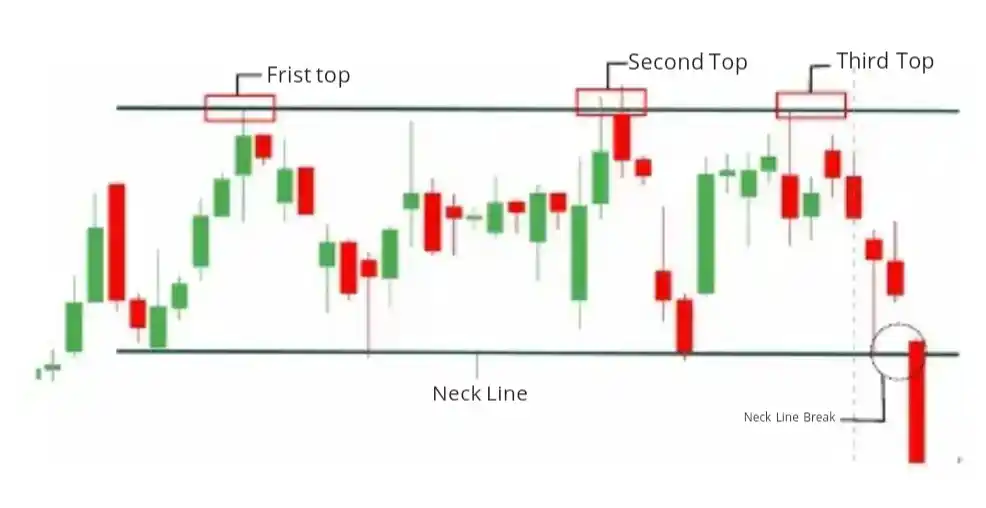
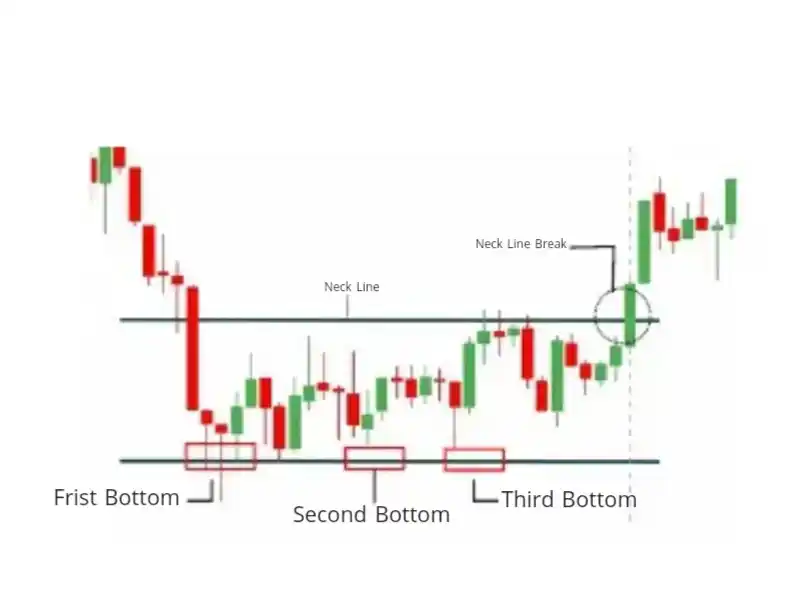
This pattern is stronger than double tops/bottoms. The price hits the same level three times.
Example:
Nifty 50 hit the resistance level of 18,800 three times before finally breaking through.
Continuation Chart Patterns
1. Cup and Handle
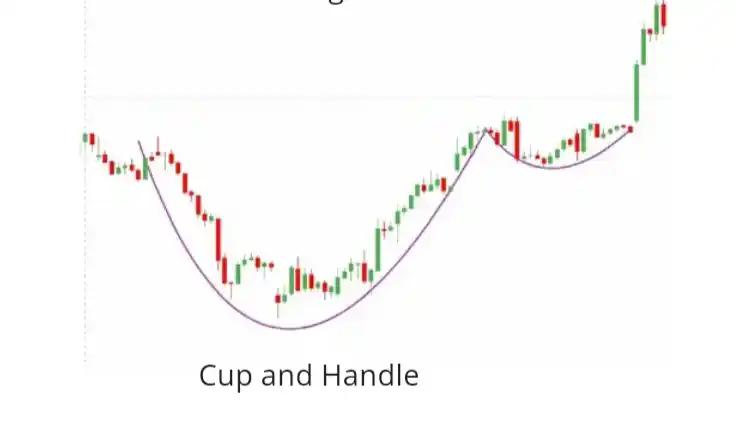
This pattern looks like a tea cup. After forming a round bottom (the cup) and a small dip (the handle), the price usually goes up.
Example:
TCS formed this pattern in 2022 around ₹3,200. After the breakout, the price moved higher.
2. Flags and Pennants
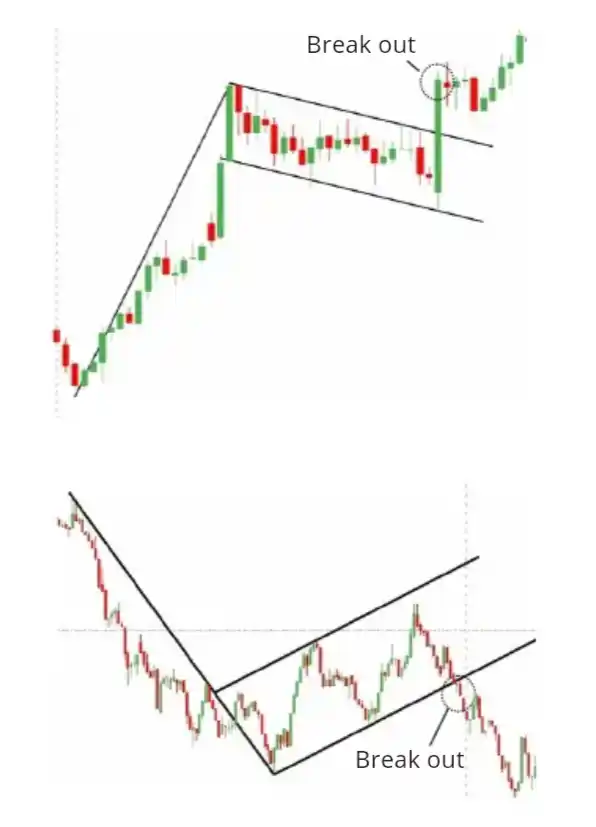
These are small patterns that appear during a strong price move. After a short pause, the price continues in the same direction.
Example:
Reliance formed a bullish flag near ₹2,400 before continuing its upward trend.
3. Triangle Patterns
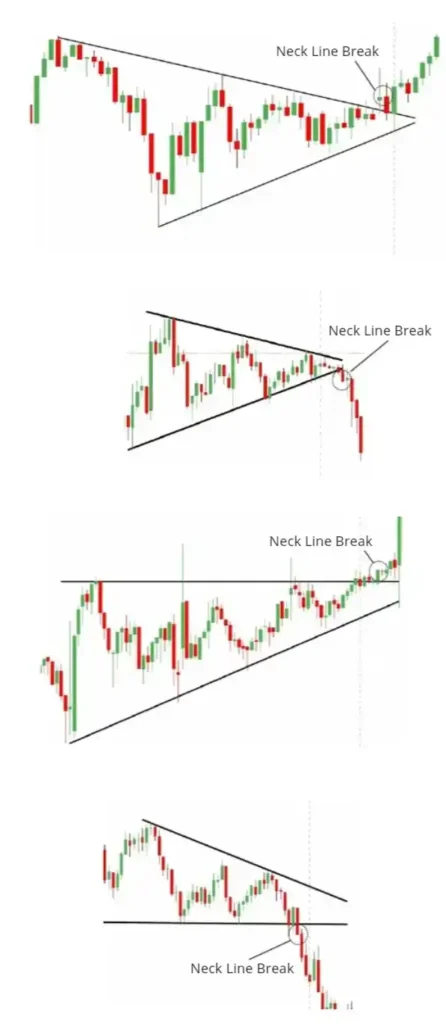
- Ascending Triangle: Higher lows and flat resistance. It’s a bullish pattern.
- Descending Triangle: Lower highs and flat support. It’s bearish.
- Symmetrical Triangle: Price gets squeezed and breaks out in either direction.
Example:
SBI formed a symmetrical triangle in 2023 and broke out upward, leading to a price rise.
4. Wedge Patterns
- Falling Wedge: Price moves down in a narrowing pattern. It’s bullish.
- Rising Wedge: Price moves up in a narrowing pattern. It’s bearish.
Example:
ICICI Bank formed a falling wedge in 2021. After the breakout, the stock moved up.
Why Are Chart Patterns Important?
Chart patterns help traders:
- Identify entry and exit points
- Predict price breakouts or reversals
- Understand market psychology
- Plan trades with more confidence
However, no pattern is 100% correct. They should be used with other tools like volume analysis and indicators.
Conclusion
Chart patterns are a simple and effective way to read the market. By learning patterns like head and shoulders, double bottoms, cup and handle, and triangles, you can make better trading decisions in the Indian stock market.
Keep learning, keep practicing, and always trade with discipline. Over time, you’ll get better at spotting these patterns and using them to your advantage.